
 By
By CLICK HERE FOR YOUR FREE MEDWAY PROPERTY NEWSLETTER
“Tell me what is happening to the Medway property market”, asked the friend of a friend at a recent do I went to in Medway (after finding out I was an agent in Medway).
I always reply, “It depends if you are buying, selling or both”.
The Medway property market is like a seesaw. For the last two years, it has been quite firmly in the realms of a 90% seller's/10% buyer's market.
However, unless you are a Medway buy-to-let landlord, Medway first-time buyer, or executors selling a deceased person's estate, most home movers are both (i.e. they are both sellers and buyers).
So, what determines where we are on the seesaw of a seller’s market or a buyer’s market?
It comes down to simple supply and demand economics. i.e. the number of properties on the market versus the number of buyers in the market.
Like when someone sells goods or services, it's the same with property. So, when we have a low supply of properties on the market and high demand for properties to move into (like we have had for the last two years since the end of lockdown one), house prices go up.
Medway house prices are 12.8% higher than a year ago.
The other side of the coin was seen in the Credit Crunch years of 2008/9. Many people wanted to sell their houses in Medway, yet the banks weren’t lending, so people couldn't buy. This meant the supply of property on the market exceeded demand; hence Medway house prices dropped by 16% to 19% in 18 months (depending on what type of property you were selling) as we had a 20% seller's market / 80% buyer's market.
Whilst demand and supply are the key driving force on the balance of the buyer/seller’s market seesaw, it is not the only influencer of the property market. The price band is also an essential determiner of house prices, albeit over the longer term.
To show this, initially, I will go back to 1995 to ascertain what has happened to average house prices over the long term in Medway.
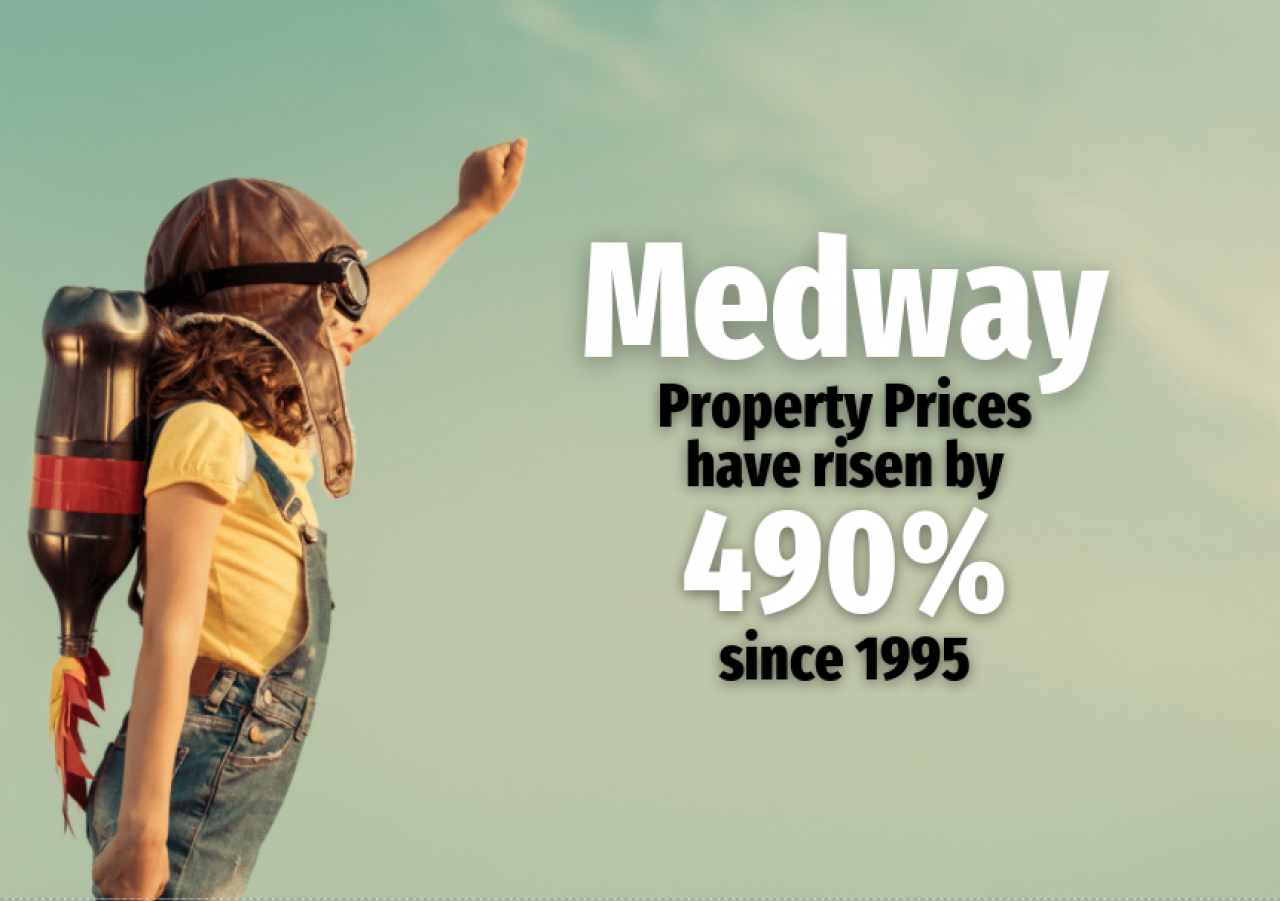
The average Medway house price has risen from £50,766 in 1995 to £299,736 in 2021, a growth of 490.4%.
Interesting, when you compare that against the national figure of 407.2%. Also, looking at where our local authority stands against other areas, we are 61st out of 331 local authorities in England & Wales for house price growth.
It’s called the property ladder for an excellent reason, and the health of the whole Medway property market is very dependent on those bottom rungs of that ladder.
Therefore, looking at the data for our local authority, paying particular attention to the lower end (in terms of price), some intriguing data comes to light. It is crucial as the lower end of the property market (in terms of price) is a good bellwether for the whole Medway property market.
So, I looked at the following …
Lower 10th Percentile of the Medway housing market – i.e., the bottom 10% in terms of the value of properties sold – e.g., small apartments and ex-local authority properties in the less popular areas, which mainly attract buy-to-let landlords.
Lower Quartile of the Medway housing market – i.e., the bottom 25% of Medway property in terms of their value, e.g., first-time buyer homes and mid-market buy-to-let property.
… and if one looks at our figures for Medway and the whole local authority, you can see the three parts (lowest 10% / lowest 25% and overall average) have performed slightly differently.
The average value of a Medway property sold in 1995 in the lower 10th percentile (i.e., the bottom 10% of the Medway property market) was £28,000, and in 2021, it was £183,000, a growth of 553.6% (compared to the national average of 428.4%).
The average value of a Medway property sold in 1995 in the lower quartile (i.e., the bottom 25% of the Medway property market) was £35,970, and in 2021, it was £225,000, a growth of 525.5% (compared to the national average of 417.7%).
Some of you might be asking yourself, what do all these different figures mean to Medway homeowners, first-time buyers and landlords?
As the overall average is below the lower 10th percentile and lower quartile growth figures, the lower end market in Medway has performed better than the middle to upper in terms of house price growth since 1995.
The thought I am trying to get across to every Medway homeowner/buy-to-let landlord is that there isn’t just ‘one’ Medway property market.
There are markets within markets - almost like a fly's eye. It is essential not to look at just the headlines but delve deeper when considering what is really happening and not to just look at the overall averages.
As we enter the height of the summer, the Medway property market seesaw has started to change ever so slightly, changing from the 90% seller's/10% buyer's market we have had in the last two years to more of a 70% seller's/30% buyer's market.
With that in mind, if you can spot trends before anyone else is aware of them you could find yourself some potential Medway property bargains.
One place for more information is my Medway Property Market blog. If you are a landlord or thinking of becoming one for the first time, and you want to read more articles like this about the Medway property market together with regular postings on what I consider the best buy to let deals in Medway, then it is well worth reading. You can also email me at spencer@docksidekent.com
If you are in the area feel free to pop into the office which is based at Station Road, Strood, Kent, ME2 4WQ
Don’t forget to visit the links below to view back dated deals and Medway Property News.
Click Here For Your Free Medway Property Valuation
Free Valuation - https://docksidekent.com/value-my-property
Blog – http://www.medwaypropertyblog.com/
Facebook – https://www.facebook.com/DocksideP/
Website – http://www.docksidekent.com/


Share this with
Email
Facebook
Messenger
Twitter
Pinterest
LinkedIn
Copy this link