
 By
By In this post credit crunch world of sub terrain low interest and annuity rates so low a limbo dancer would struggle, the growth of buy to let since 2009 has been phenomenal. So much so, there has been an evolution in the purchase of property in the UK. Property used to be for just buying the roof over one’s head but has evolved to that where it is seen as a standalone financial asset to fund current and future investment. So recently, a few days before the release of latest Land Registry data of property transactions, quite a few market commenters were anticipating a huge increase in the number of properties sold in January ahead of the 1st of April 2016 stamp duty deadline got closer.
Looking at the most recent set of data from The Land Registry, it seems there has been a drop in the number of completed property sales in the Medway Council area. Year on year, completed property sales in January (the latest set of data released) fell by 8.79% to 301 compared with 330 in January 2015. Nationally, the number of completed house sales fell by 5% in January 2016 compared with January 2015. Some might say this counters the reports that there was a rush by landlords to buy property ahead of the 1st April 2016 deadline but where was the stampede that many expected?
Looking even closer to home, in the ME2 postcode in January 2016, 48 properties changed hands, whilst 58 properties did so in January 2015. It’s even more interesting when you look at the average price paid. In January 2016, it was £200,151 yet in January 2015, the average price paid was £229,503.
Is the buy to let dream over for Medway landlords?
As ever my Medway Property Blog readers, the devil is in the detail. The 3% stamp duty surcharge for buy to let landlords was announced in the Autumn Statement on the 25th November 2015. As anyone who has bought a property will tell you, from an offer being accepted to receiving the keys and monies paid is a long drawn out affair. The process takes on average 8 to 12 weeks and the Land Registry only get notified upon completion of the sale. We also need to factor in that most solicitors seem to have the last two weeks of December off anyway.
So, if there was a rush in the last few days of November/early December in the Medway property market, we would only see the results of that in the February figures (released in June) and more probably March’s (released in July).
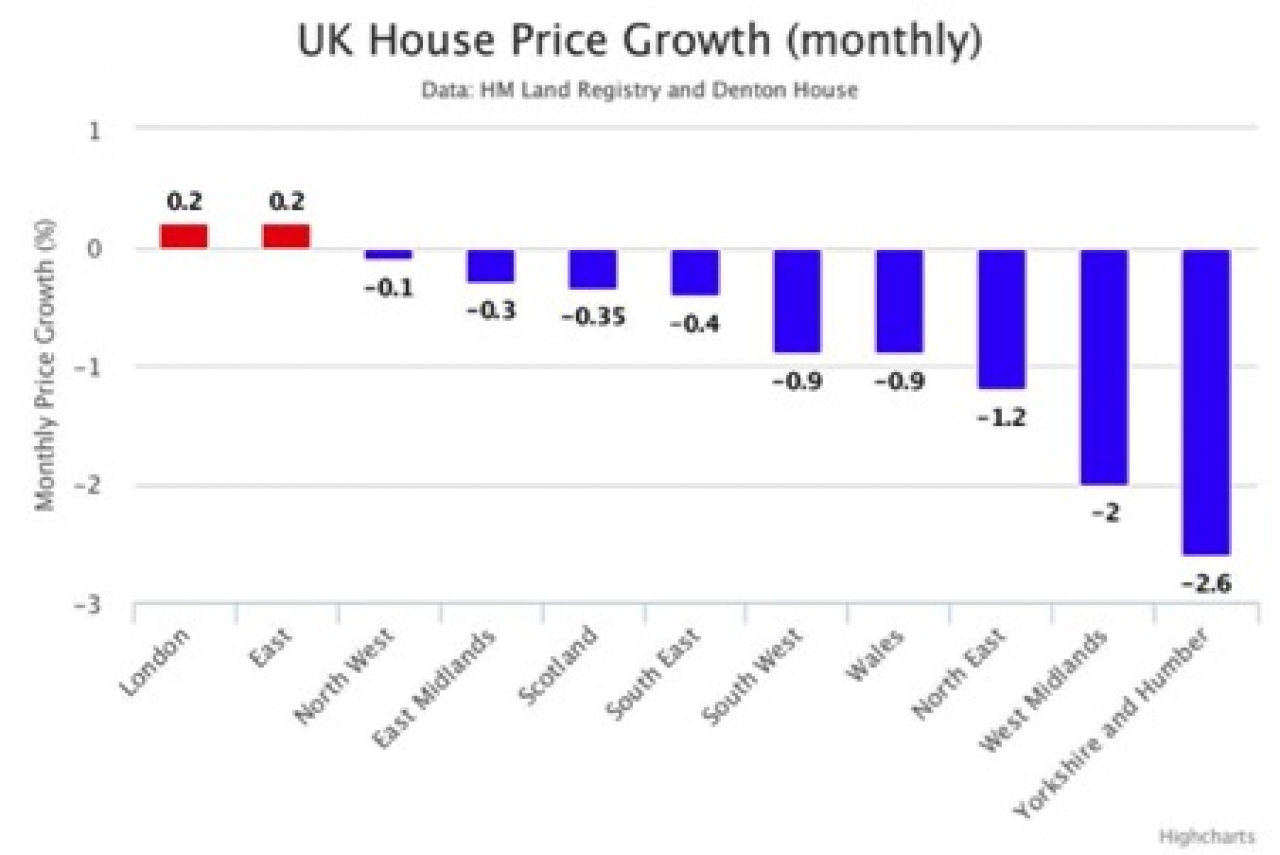
So why all the doom and gloom? Simple. Bad news sells newspapers and gets the headlines. Let’s be honest, the headline to this article is designed to be eye catching. However, when we look at both the bigger and smaller picture; nationally, property values dropped (month on month) by 0.5%; in the South East region they dropped 0.4%, whilst in Medway they rose by 1.2%. The year on year figures tell a completely different story to that:


Share this with
Email
Facebook
Messenger
Twitter
Pinterest
LinkedIn
Copy this link