

 By
By ‘An Englishman’s Home is his Castle’ is a phrase that was coined in Victorian times and a phrase that nicely summarises our pre-occupation with home ownership. In previous posts I have looked at various European countries and their rate of home ownership. So, on a similar vein I think it is interesting to note that in a league of the top 46 economic nations of the world, where owning your property is permissible, the UK is only ranked no.37.
As I mentioned a couple of weeks ago, at the end of the First World War, 77% of people rented their home (the vast majority renting from a private landlord as Council Housing was still very much in its infancy). Homeownership rose very slowly in the 1920’s and started to grow as the economy grew after the Great Depression. However, after the Luftwaffe had flattened huge swathes of housing in the early 40’s, the priority was to get people into clean and decent accommodation. Local Authority’s (Councils) took up the baton and they built large council estates in the 1950’s and 1960’s.
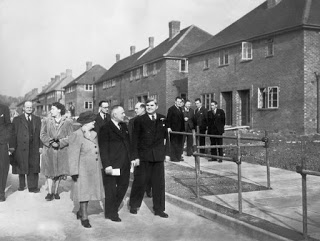 |
| The completion of the 500th British council house. |
As the UK economy got back on its feet in the middle part of the 20th Century and wages rose, people decided they wanted to own their own home instead of renting. Throughout the post war decades, it became easier to secure a mortgage. Interestingly, by 1977, 61.6% of 30 to 34 year olds were owner-occupiers with a mortgage compared to 8.7% of 30 to 34 year olds being in private rented accommodation (the remaining either being in council housing or living with friends or family). Ten years later, in 1987, we saw some significant growth in homeownership, as 68.2% of 30 to 34 year olds had a mortgage and only 4.6% of people privately rented. A decade later and there wasn’t much change as, in 1997, the homeownership figure was 68.3% but private renting had jumped to 12.1% in the same 30 to 34 year old age group.
Move on another ten years to the 2007 figures which show a slight drop in homeownership to 65.8% whilst renting had continued to increase to 18.7% (in the 30 to 34 year old age group). The latest set of figures is for 2014, and only 47.2% of 30 to 34 year olds had a mortgage and an eye watering 33.4% of 30 to 34 year olds privately rent.
 |
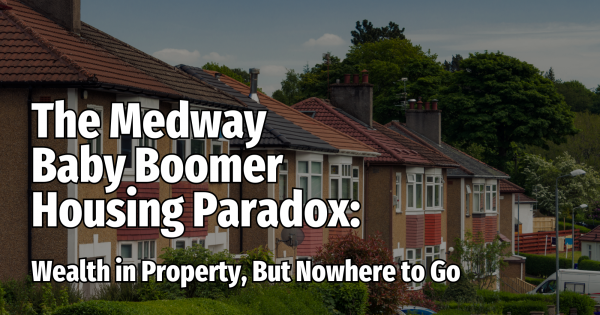
| Over a third of 30-34 year olds in Medway rent privately! |
When we look at the Medway figures of homeownership, looking back to 1991, 70.9% of Medway households were owned by the homeowner, whilst 7.95% of Medway households were privately rented, whilst the 2011 census showed home ownership in Medway had dropped to 68.31% and private rented had increased to 16.1%. Much of the recent rise in the occurrence of private renting in Medway since the turn of the Millennium is not because property has become more expensive, but the fact these 30 somethings haven’t got a council house to move into (because they were all sold off) – so they have to rent. The selling of council housing in the 1980’s (a subject I have talked about in a previous article in the Medway Property Market Blog) artificially grew homeownership in the 1980’s, but as these people have got older, the younger generation didn’t have the same opportunity to buy their council house in the 1990’s, 2000’s or 2010’s. That is why, unless the council start building council houses by the acre, and hundreds of acres, private renting will continue to grow in Medway.
So if you want blame anyone , perhaps you should blame the grocer’s daughter from Grantham; Mrs T . But, before you do – do remember in the 1970s, the UK was called the "sick man of Europe" by critics of the UK government, because of industrial strife and poor economic performance compared to other European countries. This culminating in the Winter of Discontent of 1978 and 1979 , arguably if it hadn’t been for her we wouldn’t be where we are today.
As ever, thank you for reading and please feel free to email with any property questions or comments on this post to spencer@docksidekent.com
You can also view my thoughts on the Medway property market HERE.
Where are my numbers from?
1. Homeownership numbers taken from Eurostat, Hypostat, and the census’s of 15 other countries
2. Homeowners in age bands - Source: Living Costs & Food Survey, Expenditure & Food Survey, National Food Survey
3. Homeownership figures are parliamentary constituencies.


Share this with
Email
Facebook
Messenger
Twitter
Pinterest
LinkedIn
Copy this link